A Better Rating System For Board Games – Weight & Complexity Spider Graphs
After posting my thoughts on separating the weight and complexity ratings for board games on Reddit/boardgames, there was a good amount of feedback and discussion. While the majority of board gamers seem to be in favor of separating the two, others were firmly opposed. I would guess they were more opposed with my personal method of separating the two than being against a better board game rating system itself. I say that because the overwhelming feedback was, “We need a better way of rating board games for their inherent weight, complexity, depth, & strategy components.“. The BGG weight/complexity rating is too nebulous for most people’s liking.
The problem was, everyone had the own interpretations, wants and desires when it came to the definitions being used, which definitions were being used and how to score concepts or traits that are not easy to score in a vacuum. However, the tone of the discussion was there are basically two parts of a board game; the amount of time/effort/dedication to learn how to play a game, and the amount of strategy, decision making, and unique ways a game could unfold once you started playing. Essentially a before and after of board gaming. “Before” is everything involved with learning to play competently. “After” is the amount of strategy or permutations available during play.
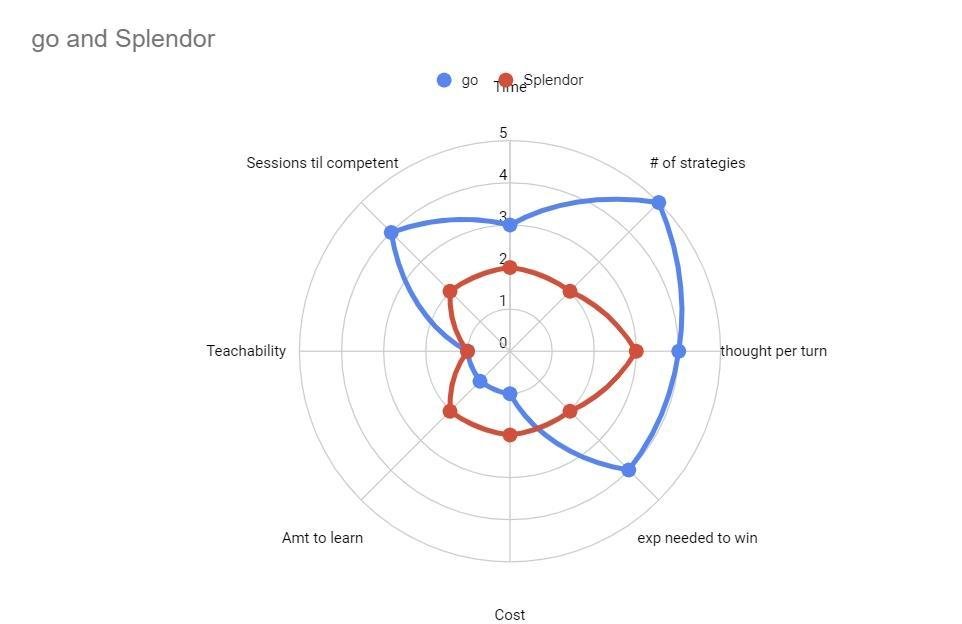
To complicate matters, there were components that made up the learning process, and components that made up the playing process. In order to determining if a game is to a player’s liking, or for recommendation purposes, each of these subcomponents of Learning & Playing needed to be rated to help separate one game from another. This led to the idea of utilizing spider graphs (also called radar graphs), as they are the best type of graph for visualizing and comparing two objects that share a list of traits(or skills when applied to humans). Don’t get hung up on the ratings assigned to each game. Those rating would eventually be determined by the board gaming community and manufacturers. Try to evaluate the concept and not the ratings themselves.
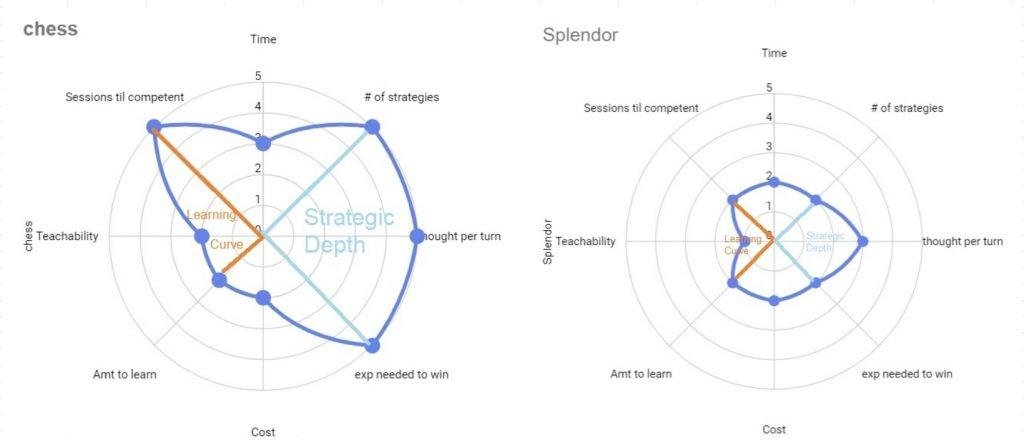
There was an advantage to using spider graphs beyond the ability to rate numerous traits. Spider graphs are essentially a bullseye set on your typical X Y axis graph. This bullseye appearance allows for a BEFORE(The left half of the bullseye circles) & AFTER(the right half of the bullseye circles). This allows the left side measurements/ratings to represent components involved in learning the game, and the right side metrics are ratings concerning game play aspects. Thus if the graph contains a lot of graph area on the left side, it is a difficult game to learn. If the game contains a lot of graph area on the right side, it is a game with a lot of strategy and depth during game play. This allows board gamers to instantly recognize whether the game has a steep learning curve and/or how much strategy and thought is required during play with a simple glance at the spider graph.
Learning was broken down into 3 components: Amount to learn, Teach-ability, Sessions Until Competent
Amount To Learn: This is fairly straightforward. How big is the manual, reference charts, and any instruction material included with the game. If there are external sources that must be consulted, these should be included. A game that can be learned in 5-15min would score low on amount to learn.
Teach-ability: Can the game be taught verbally? Can one gamer teach another how to play competently without the new player having to read all the rules? A game that could be taught to a child would score low on teach-ability.
Sessions Until Competent: Some games require many game plays before a player feel competent playing. This type of game would score high in Sessions. A game that a player feel comfortable playing after the first or second game, would score low on Session.
With all three metrics, a game scoring high is harder to learn or teach, while a game scoring low is easier to learn or teach.
Playing was also broken down into 3 components: Number of strategies possible, thought needed per turn, experience needed to win.
Number Of Strategies Possible: A game that allows a great number of strategies would score high. A game that has limited strategic possibilities per turn or per game, would score low.
Thought Needed Per Turn: A game that requires a lot of thought or for a player to consider numerous permutations or outcomes each turn or round would score high. A game in which decisions are limited or non existent would score low.
Experience Need To Win: A player that could learn a game and win at first or second go, would score low. A game that requires a player to lose to learn and/or experience numerous games in order to finally be able to beat knowledgeable opponents would score high.
And this would have worked brilliantly except for one issue inherent to spider graphs, and that is they always set the first trait rating on the top of the Y axis(or due North if you want to think of it that way) and works clockwise placing the rating “arms” in the graph. Which meant that 1st and 4th ratings would appear on the North and South poles, completely ruining the concept of looking at the Left & Right side of the graph for Learning & Playing ratings. Instead the whole graph was cocked and the intended quick glance effect was gone.
But all was not lost. I also wanted to find a way to get ratings for time needed to play and game cost into the ratings.
Time Needed To Play: This is simple. A game that takes a long time to play gets a high rating, a game that can be played in 15-20 minutes gets a low rating.
Game Cost: Again simple. An expensive game gets a high rating. An inexpensive game gets a low rating.
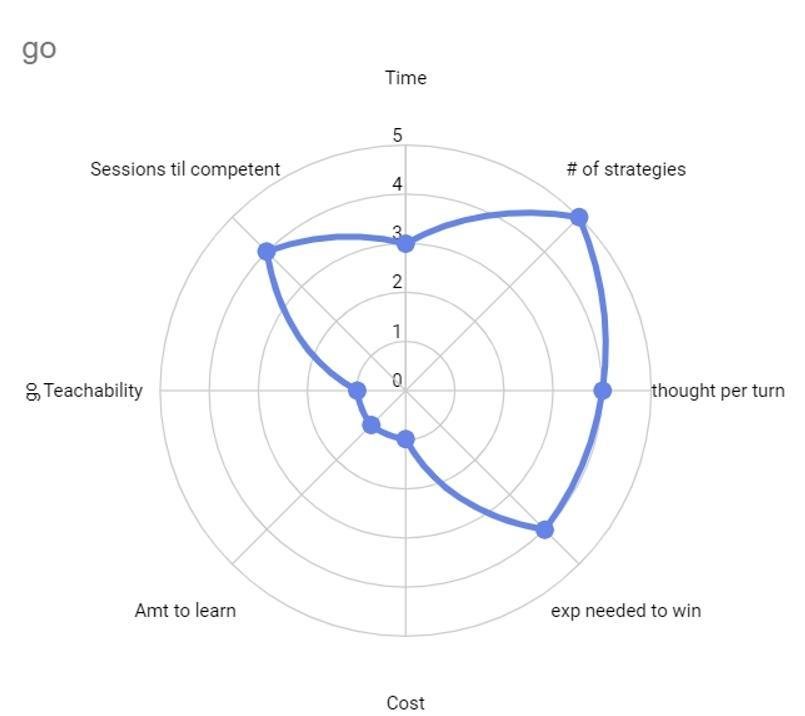
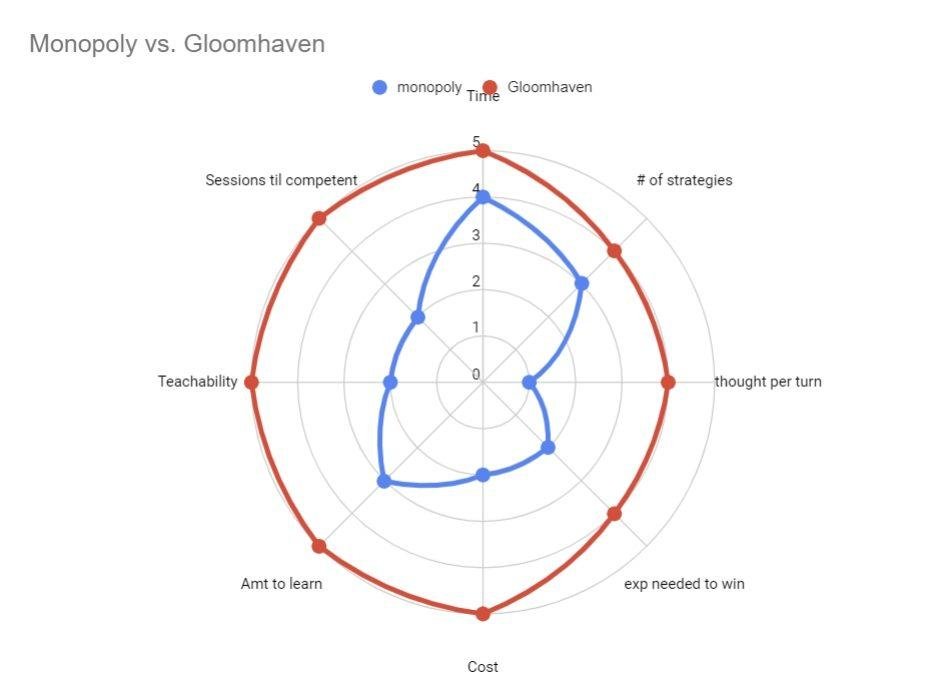
By setting Time Needed To Play as the 1st rating and Game Cost as the 5th rating, I could set those two ratings at the North & South poles. Thus ratings 2, 3, 4 were for PLAYING, and ratings 6, 7, 8 would be for LEARING. Thus the spider graph sets Time on the North Pole, and Game Cost on the South Pole. It then places the PLAYING rating on the right side(remember it works clockwise when placing rating arms), and the learning ratings on the left side. And lo and behold, the ability to tell learning depth from playing depth is as simple as looking at one side of the graph or the other.
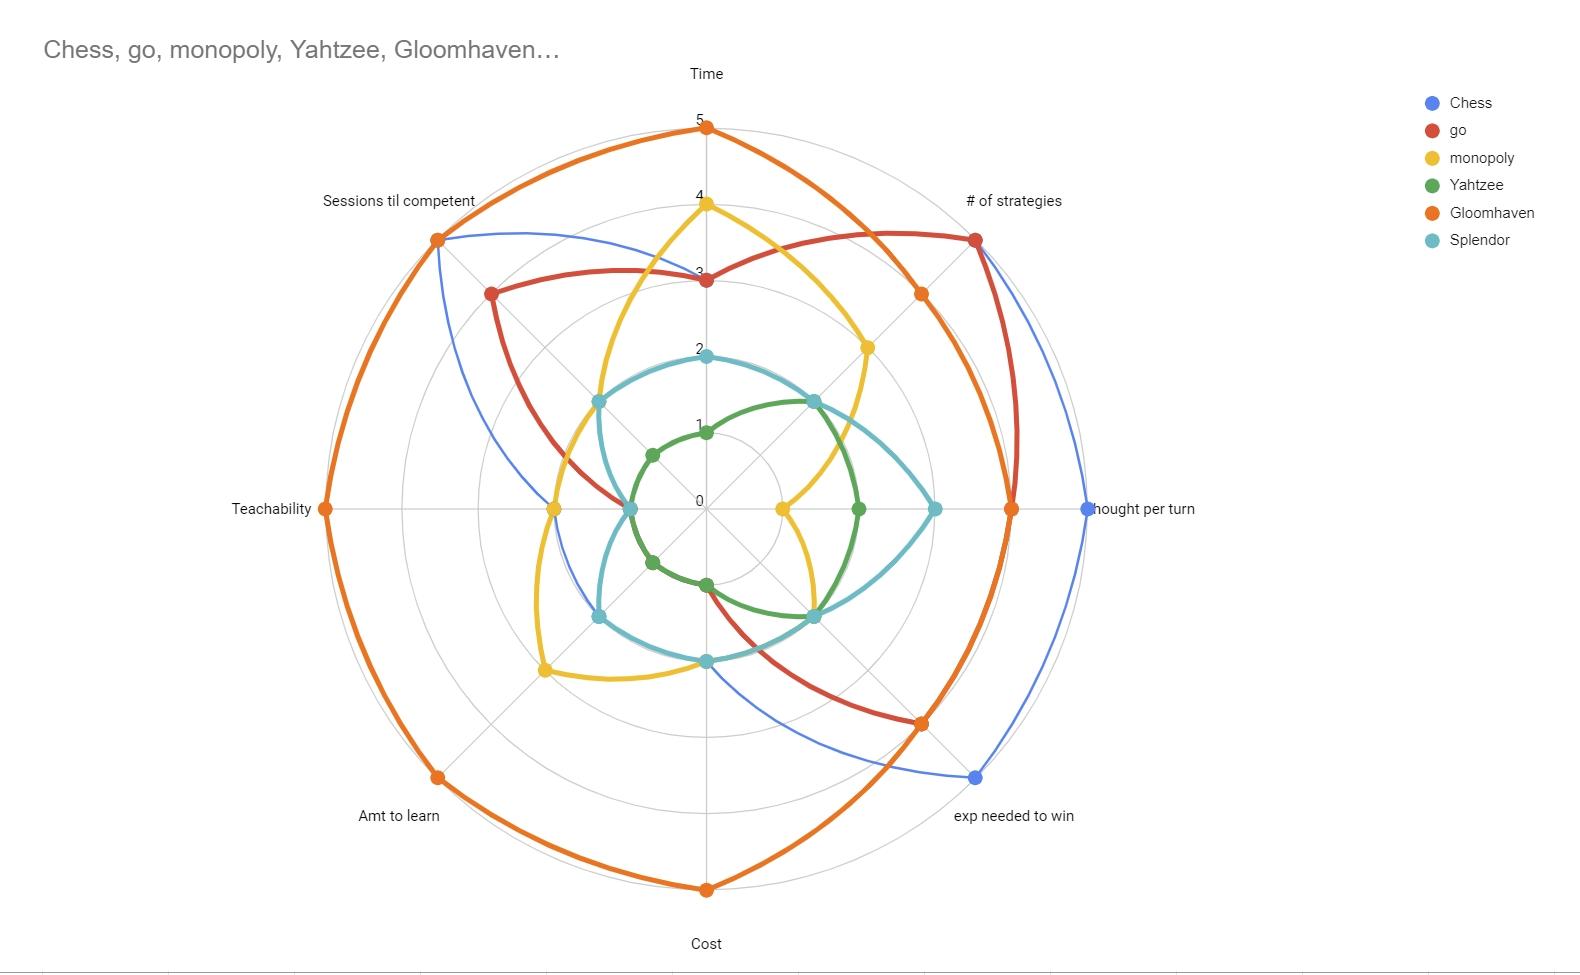
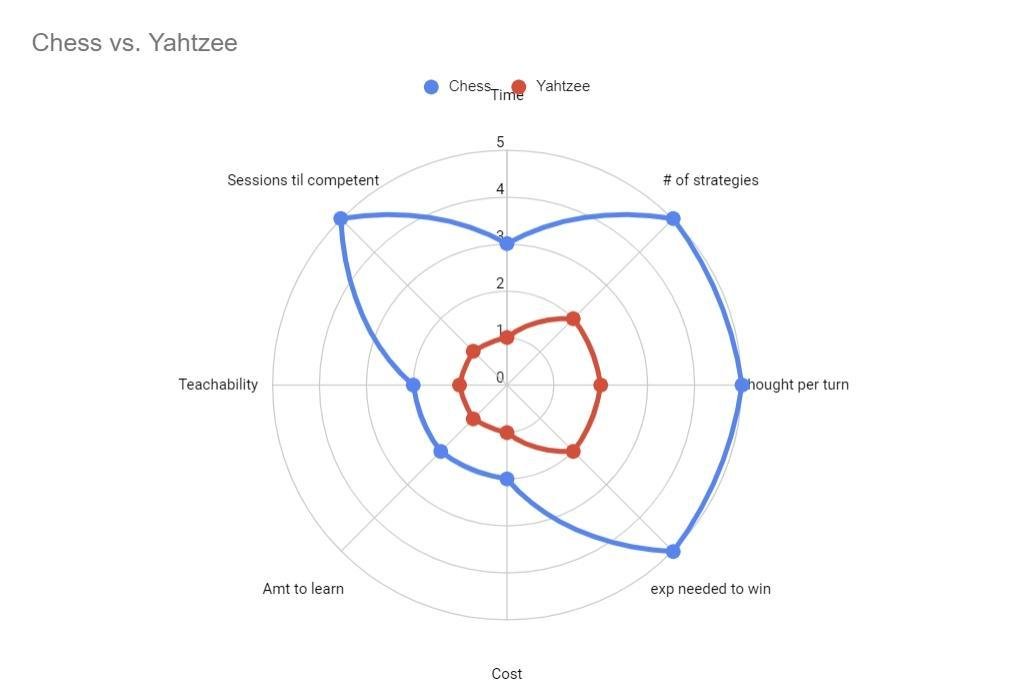
So every board game now has 8 ratings. Time, cost, 3 components based on learning a game, and 3 components based on playing the game. This gives each game a semi-unique spider graph(I semi-unique because there are a finite amount of unique spider graphs available when using 8 ratings each rated between 1 – 5). The shapes of the spider graphs can easily be compared to determine whether a game is more or less like what a player is looking for or is recommending. Eventually each gamer would become familiar with the spider graph shapes that separate games with differing amount or learning and playing weight or complexity. In addition, a player could list games they like and they look for similar spider graph shapes in other games they are considering allowing them to a pick a game right for them or someone else.
Implementing this on BGG or a separate site would be a simple matter. User could be asked to simply rate each game in the 6 or 8 categories(time and cost may be set ratings based on the game msrp and normal playing time) via simple radio buttons or text fields. A database would store the values for each game and generate the spider graph which would change over time as the ratings settle into their final user ratings. A user could simply use a product compare feature to either set numerous spider graphs to a single page or combine into a single graph.
The end result should end up being a much more usable and better system for rating and recommending board games. An added benefit for manufacturers is that a single spider graph could replace all the space used to set different ratings on the board game boxes. If adopted across the industry* the end result would be a huge benefit to gamers who simply want to know if the game they are looking at is one that would be enjoyable to them, a relative or a friend.
Author’s Note: In mere hours, Reddit Users have made the concept better. Click the link below to read more or chime in.
Follow The r/boardgames Discussion On Spider Graph Ratings
*This would rely on a lot of tweaking as to which components are rated, what are the names, etc…I don’t expect this is an out of the box, wrote it on a blog so set it concrete type of thing. It would require the thoughts and inputs of many gamers and game designers in order for the spider graphs to be polished, refined, and finalized.